Journal of Investment Consulting — Mitigating Loss Trauma
Jul 9, 2025 5:13:00 PM
In the latest issue of the Journal of Investment Consulting (Vol. 23, No. 1, 2024), authors William J. Trainor, Jr., PhD, CFA®, and Anca Traian, PhD, examine how cash-secured puts can serve as a compelling alternative to dollar-cost averaging and protective put strategies for risk-averse investors. By comparing historical performance, risk-adjusted returns, and behavioral considerations, they explore how writing out-of-the-money, cash-secured S&P 500 puts can both mitigate loss aversion and enhance entry points into the market. Their analysis highlights when this strategy may outperform traditional approaches, particularly in volatile or uncertain market environments.

Mitigating Loss Trauma
CASH-SECURED PUTS
By William J. Trainor, Jr., PhD, CFA®, and Anca Traian, PhD
ABSTRACT
Dollar-cost averaging or the use of protective puts often is suggested to encourage investors to move cash into equities to manage loss aversion. Alternatively, writing out-of-the-money cash-secured put options may be more attractive because the investor sets the amount of discount required to enter the market. This study finds writing monthly 2.5-percent, 5-percent, or 10-percent out-of-the-money S&P 500 (SPY) cash-secured put options results in superior returns relative to dollar-cost averaging (DCA), protective puts, and the market itself if the puts end up exercised within the year. However, only the 2.5-percent out-of-the-money put does as well as DCA when the puts are not exercised.
In addition, all three strategies significantly underperform the market in bullish environments by an average of 8–10 percent. When risk-adjusted returns are considered, the cash-secured put strategy has significantly higher Sharpe ratios but also higher Value-at-Risk (VaR) and expected shortfall metrics. The main downside to a cash-secured put strategy is the uncertainty of entering the market because the puts may continually expire unexercised. However, with short-term interest rates now exceeding 5 percent, the opportunity cost of the cash position is mitigated relative to the previous decade. Using non-overlapping annual data suggests this strategy may even outperform the market over time.
KEY TAKEAWAYS
Using cash-secured S&P 500 puts results in superior returns relative to dollar-cost averaging, protective puts, and the market itself if the options end up being exercised.
The probability that out-of-the-money 2.5-percent, 5-percent, and 10-percent monthly written cash-secured puts are exercised within a year are 84 percent, 56 percent, and 27 percent, respectively.
The drawback of cash-secured puts is that there are no guarantees the investor enters the market and when the puts remain out-of-the-money, the average annual loss relative to the market is 8–10 percent.
When comparing non-overlapping returns from 1990 to 2023, the S&P outperforms ten out of thirty-three years; but the secured 2.5-percent, 5-percent, and 10-percent put strategies outperform six out of the thirty-three years each, meaning one form or another of a cash-secured put strategy outperformed in eighteen of the thirty-three years.
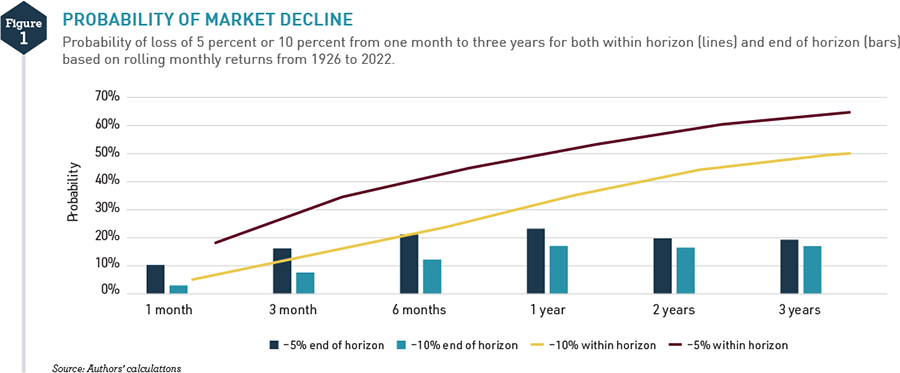
PROBABILITY OF MARKET DECLINE
Loss aversion is a major deterrent to investing in the equity market with good reason. Figure 1 shows the probability of being down more than 5 percent or 10 percent at any time during the next three years. Although there is only a 17-percent chance an investor will be down 10 percent or more at the end of one year, there is a 35-percent chance the investor will be down 10 percent sometime within the next year. This is considered within horizon risk (Kritzman and Rich 2002) and does not decrease with time.
.
.
Financial planners often find it challenging to convince clients to enter the market, especially during high volatility periods or when bearish predictions are looming. Even though the bull periods last longer, and the gains exceed the losses (Csiszar 2022), the risk often keeps investors on the sideline, usually in cash, because the trauma of loss outweighs the euphoria from gain (Kahneman and Tversky 1979). With inflation, higher interest rates, and high volatility (VIX above 20 for 91 percent of the trading days in 2022), this concern is more present than ever. To mitigate significant trauma, DCA often is advised despite work as far back as Constantinides (1979) demonstrating lump-sum investing is superior to DCA based on expected return considerations. Even after accounting for risk, most research still finds lump-sum investing superior (Knight and Mandell 1993; Rozeff 1994; Leggio and Lien 2003; Williams and Bacon 2004). However, several studies demonstrate that DCA has advantages over lump-sum investing in certain circumstances (Israelsen 1999; Milevsky and Posner 2003; Dubil 2004; Trainor 2005).
Another strategy employed by financial planners to convince investors to enter the stock market is using a protective put. This approach purchases put options to protect investors’ long positions. Investors pay the premium, often overpriced by most measures, but protect their portfolios against losses. The benefits and limitations of this strategy have been researched and documented (Aggarwal and Gupta 2013; Israelov 2019; Foltice 2022).
On the other side of a protective put strategy is implementing a cash-secured put strategy. A cash-secured put is writing a put option on the underlying asset while having the cash on hand to buy the underlying asset if the put option expires in-the-money and is exercised. An investor who writes a put option 5-percent out-of-the-money and earns a 2-percent premium effectively creates a 7-percent discount to the current price if the put option ends up exercised. This would mitigate some of the trauma of entering the market immediately and suffering through a market decline.
Previous research has shown that this strategy may have value because out-of-the-money index put options tend to be overpriced due to demand for them as insurance, i.e., the protective put strategy (Rubinstein 1994; Jackwerth 2000; Bondarenko 2014). This detail also shows up in the well-known volatility smile, which usually smirks for index options showing higher implied volatility for out-of-the-money options due to higher premiums. Although several explanations attempt to explain the mispricing, Driessen et al. (2009) as one example, Bondarenko (2014) suggests a large class of models cannot remotely explain the put anomaly. Thus, a strategy that writes put options (cash-secured) rather than buys (protective puts) may be more attractive. Furthermore, Ungar and Moran (2009) shows that the Chicago Board Option Exchange (CBOE) Put Write Index, which uses at-the-money put options, often outperforms the S&P 500 with less volatility, especially during bear markets. Using short-term out-of-the-money options has the additional advantage of greater time decay, which increases as expiration approaches and is an advantage to the option writer.
This study extends the research in this area by examining the benefits and costs of using a cash-secured put compared to the more traditional DCA and protective put strategies. A cash-secured put approach can be appealing during periods of uncertainty when investors fear a bear market and high volatility. This way they will enter at a lower point (or not enter at all) and receive an additional discount generated by the premium received from selling the put. The potential cost of the strategy is being left "holding the bag" if the market goes on a sustained bull run and the put is never exercised.
DATA AND METHODOLOGY
To examine the cash-secured put strategy, monthly 2.5-percent, 5-percent, and 10-percent out-of-the-money put options are written on the third Friday of each month. Three-month 5-percent and 10-percent out-of-the-money put options written every December, March, June, and September also are examined. Because time decay increases as expiration approaches, the use of short-term options is especially beneficial to option writers. Using out-of-the-money puts also takes advantage of volatility smiles, which usually smirk showing higher option values. The cash position is calculated as the discounted value of the strike price plus option premium using the one-month or three-month Treasury-bill (T-bill) rate, respectively. New one- or three-month put options are written as the previous option expires until or if it is exercised. If the option is exercised, the investor is assumed to remain fully invested in the S&P 500 for the remainder of the twelve-month period.
For example, on March 19, 2021, the one-month 380 SPY put is written for $4.33 when the SPY is at $389.57, which is 2.5-percent out-of-the-money. The present value of the strike price and the put premium is invested in cash and earns the 30-day T-bill rate. During the next month, the secured put strategy earned 1.3 percent, the interest plus the put premium divided by the initial position. This process is repeated each month unless the put is exercised, where the loss from the exercised put is factored in. If the put is exercised, returns for the rest of the year are the SPY return, because it is assumed the investor uses the cash position to cover the exercised put.
Option prices are attained from DeltaNeutral. S&P 500 Index Options (SPX) are used from January 1990 to December 2004, when State Street’s exchange-traded fund SPY options became available, and run through March 2023. SPX options are cash settlement and psychologically not the same as being forced to buy the SPY, but the returns would be virtually the same, although there are several differences between SPX and SPY options such as taxes, dividends, cash versus share settlement, and underlying dollar exposure.
Investors implementing a cash-secured put strategy may want to use SPY options. If they are exercised, it forces the investor to buy the SPY as opposed to a cash settlement, which still leaves the investor in cash. For small investors, SPY options also are more divisible (one SPY option has 10 percent of the notional amount of an SPX option). SPX options have tax advantages because 60 percent of gains are taxed at capital gains, and the index itself does not pay dividends where the SPY does. When writing put options, this does not create any issues of early exercise, but it does decrease the SPY value, increasing the probability that the put option may end up in the money and be exercised. However, the eventual goal of the strategy is to become invested in the market, and SPY options may be more suitable in this regard, especially if used in tax-deferred accounts.
The calculations for DCA assume the investor averages into the market every month or every three months for twelve months in equal amounts so the investor is fully invested at the end of eleven or nine months, respectively. Annual returns are calculated on a rolling monthly or quarterly basis. A buy-and-hold strategy assumes all dividends are reinvested.
For the protective put strategy, the returns follow the S&P 500 minus the costs of a 2.5-percent, 5-percent, or 10-percent out-of-the-money put option. When the option is not exercised, the option cost reduces investors’ net return, but this strategy does not cap the potential gains. The downside equals the option cost plus the percentage accepted through the option selection (2.5-percent, 5-percent, 10-percent out-of-the-money). The average premiums for the 2.5-percent, 5-percent, and 10-percent out-of-the-money one-month put options were 1.1 percent, 0.7 percent, and 0.4 percent, respectively, and 2.1 percent and 1.3 percent for the 5-percent and 10-percent three-month put options.
It should be noted that one- or three-month options are written (cash-secured) or purchased (protective put) every month for three months. Results are based on annual returns, and although the protective put minimizes losses over any given one or three months, the loss over an annual period can be much greater. As an example, a protective put strategy using a monthly 5-percent out-of-the-money option is subject to a 5-percent loss plus the put premium each month. During an entire year, the loss could be substantial for a continuously falling market.
To reflect the full benefits and costs of the above strategies, several ratios and risk measures are compared. These include the standard deviation, minimum, maximum, and the Sharpe ratio. Ungar and Moran (2009) note the data’s right skewness can affect comparisons made with the Sharpe ratio, which may be especially relevant with the implementation of these strategies.
However, when testing for normality, the Kolmogorov-Smirnova test, even at the 20-percent level of significance, could not reject the assumption of normality for any of the return data [1] Thus, the Sharpe ratio may be sufficient. Despite that, if the investor’s primary concern is the magnitude of the loss, other metrics may be more revealing. Thus, the Sortino ratio (Sortino and Price 1994) is calculated, which is a measure of return per unit of downside risk. In addition, the VaR is calculated, showing the return value where 5 percent of the observations are worse. The expected shortfall (ES) also is calculated to measure the average return for the observations below the VaR (Acerbi and Tashe 2002). S&P 500 returns (buy-and-hold) are presented for comparison.
EMPIRICAL RESULTS
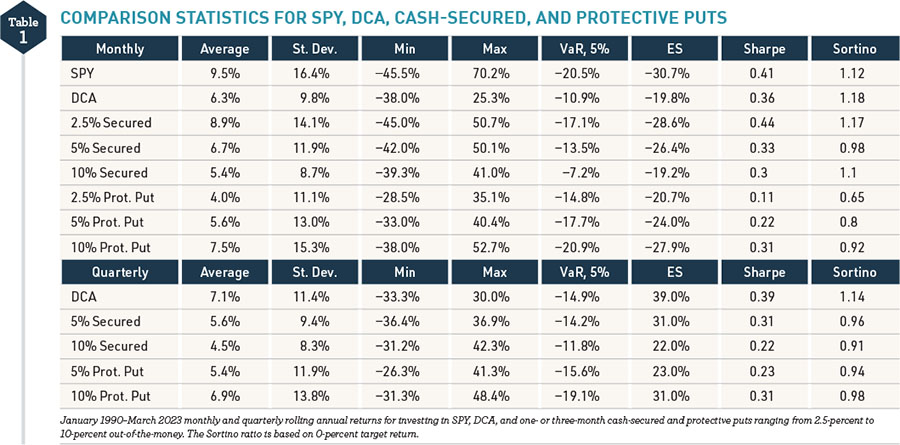
Table 1 shows summary statistics for January 1990–March 2023 for SPY, DCA, cash-secured put, and protective put strategies using 2.5-percent, 5-percent, and 10-percent out-of-the-money put options. These are annual results on a rolling monthly basis (January to January, February to February, etc.) to show all possible twelve-month periods. The average and standard deviation results are similar using non-overlapping returns, but the rolling monthly results give a better indication of possible extreme results.
The probability the options will be exercised is 84 percent for writing 2.5-percent out-of-the-money monthly put options, 55.7 percent for 5-percent out-of-the-money put options, and 47.1 percent for 10-percent out-of-the-money put options. Thus, if the investor or financial planner’s main goal is to enter the market writing monthly 10-percent out-of-the-money options this works less than 30 percent of the time. Writing the three-month 5-percent or 10-percent out-of-the-money options does increase this probability to 63.9 percent and 48.1 percent, respectively, and is a viable alternative. However, the quarterly options have less-attractive results by not taking advantage of the large time decay that occurs in the last month of an option’s life relative to the monthly options. For this analysis, note the market needs to be down 10 percent or more at the time the option expires, not just sometime within the option’s life, for the option to be exercised, because even American-style put options will not be exercised early.
Table 1 shows all the strategies sacrifice return relative to buy-and-hold. Compared with DCA though, both the monthly 2.5-percent and 5-percent out-of-the-money secured put option strategies outperform DCA but have significantly higher standard deviation, worse minimum, and much higher VaR or point at which 5 percent of the empirical observations are worse. The ES values also are worse. In addition, DCA is 100-percent certain to have an investor in the market by the end of the year when the cash-secured put strategy is uncertain. It also should be noted the worst twelve-month period for the 2.5-percent cash-secured put strategy (November 16, 2007–November 21, 2008) is little different than buy-and-hold, because the put is exercised in the first month and the investor is then 100-percent in the market during a disastrous year. The only way to mitigate this is to write a put option that is further out-of-the-money.
.
The protective put strategy offers lower returns and generally worse Sharpe, Sortino, and VaR values. Compared with the DCA strategy, protective puts fare better only when 10-percent out-of-the-money options are bought, because the premiums are much lower at this level. Although the protective puts have the smallest minimums, they have a significantly higher VaR, especially when using 10-percent out-of-the-money puts. In terms of Sharpe and Sortino ratios, the 2.5-percent secured-put strategy provides the best risk/reward combination, slightly better than the buy-and-hold strategy, although the Sortino ratio virtually is identical to the DCA.
Using three-month options tells a slightly different story, because DCA is now the best strategy in terms of return, Sharpe ratio, and Sortino ratio. The cash-secured put strategies do lower the standard deviation, VaR, and ES values. Still, with the smaller probability of entering the market relative to writing monthly options, there is little evidence to support using three-month options in a cash-secured put strategy. The relative amount of put premium collected and the smaller time decay work against writing these put options relative to writing monthly options. In general, all the strategies give higher returns applied monthly, although the risk characteristics change marginally.
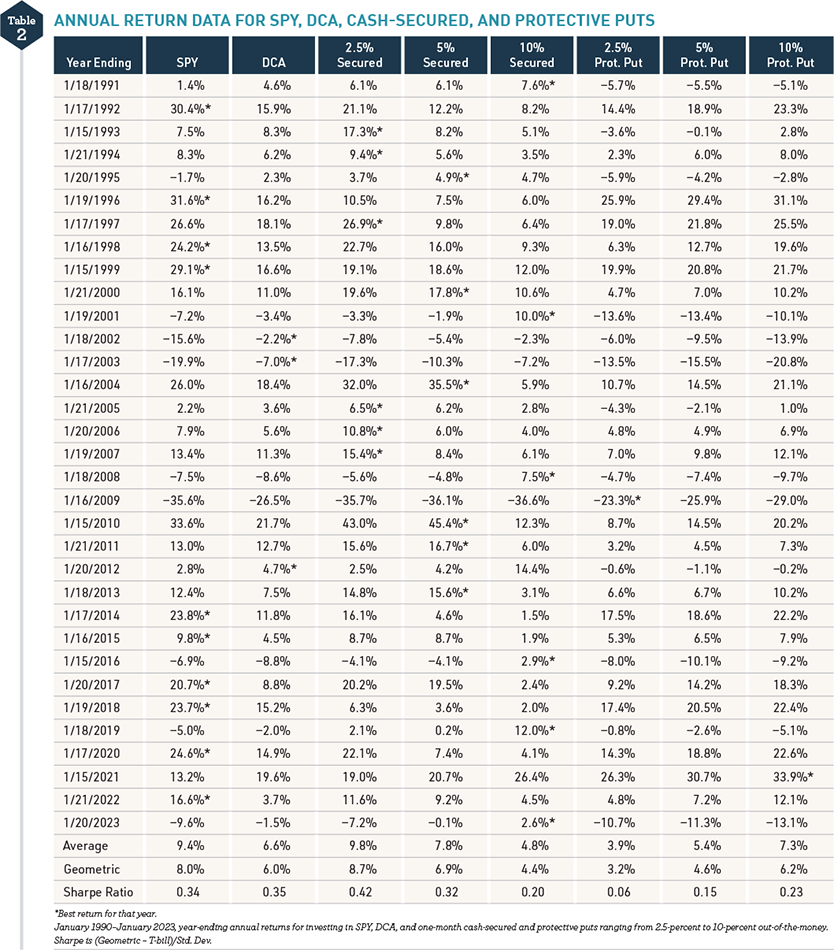
To further delineate the returns from the different strategies, table 2 shows the annual returns for years ending January 18, 1991, to January 20, 2023. These are non-overlapping returns, but the returns and risk metrics are similar for the rolling monthly and quarterly data in table 1, although the 2.5-percent secured-put strategy ends up with the highest average annual return of 9.8 percent. As expected, the SPY has the best return in ten of thirty-three years. The DCA is the best performer in three years and the 2.5-percent, 5-percent, and 10-percent secured put strategies have the best performance for six years each. The protective put strategies combined have the best return in only two out of the thirty-three years. These results are strong support for the cash-secured put strategy relative to DCA or using protective puts.
.
Although it would be somewhat bizarre to liquidate and annually restart each strategy, the geometric annual return also is given, where again the 2.5-percent secured put strategy results in the highest return, 8.7 percent, and highest Sharpe ratio. This exceeds the buy-and-hold as well and corroborates Ungar and Moran’s (2009) analysis of the CBOE Put Write Index.
UP AND DOWN MARKETS
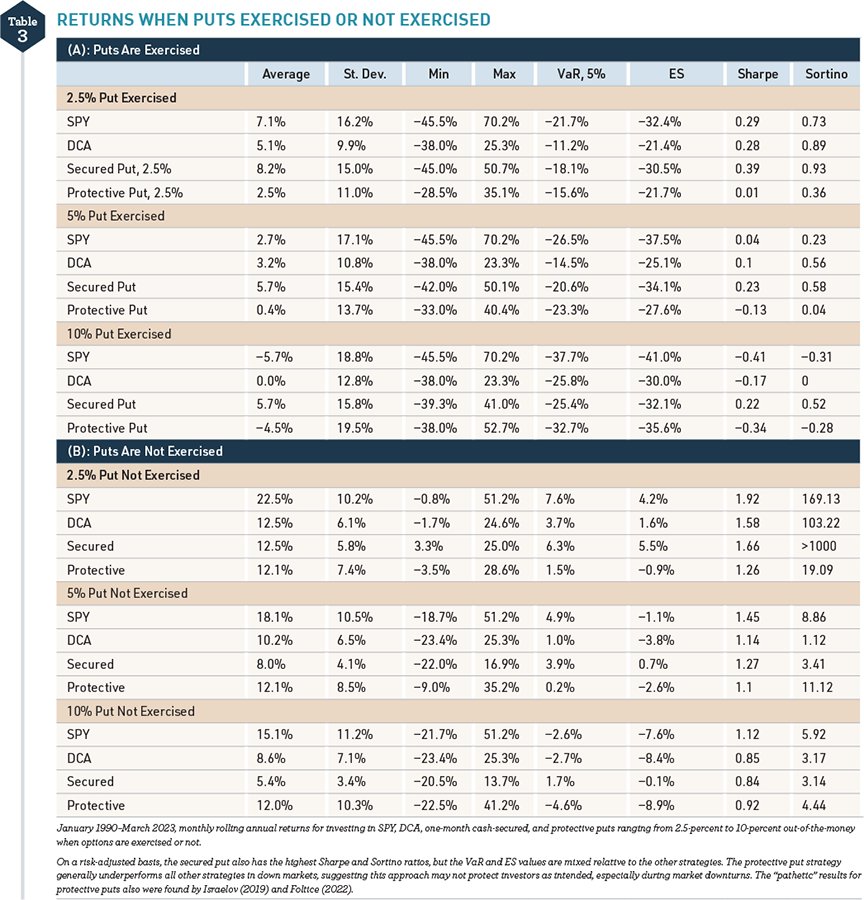
When determining which strategy may be more appropriate for any particular investor, consider that they each have risk exposures that can vary greatly. The cash-secured put goes from 100-percent cash to 100-percent equity if the put is exercised, the DCA gradually increases to 100-percent equity over the year, and the protective put is 100-percent in equity with an insurance policy using the put option to limit any losses for the maturity of the put. Thus, to further differentiate when each strategy may perform best, table 3 shows results for years when the put options are exercised versus when they are not for monthly options.
.
When the options are exercised, the market has declined at some point during the year and the returns represent that. Using 2.5-percent, 5-percent, or 10-percent monthly out-of-the-money secured put options results in the best returns over all other strategies, although the DCA does result in less risk. The 10-percent secured put option has the greatest outperformance, more than 10 percent relative to the S&P and protective puts and 5.7 percent over DCA, but recall this only occurs 27 percent of the time, as noted in table 1. Thus, the more reluctant an investor is to enter the market due to a pessimistic outlook, the more attractive the secured put option strategy becomes.
A drawback to all the strategies is in rising markets, as defined when the options are not exercised. Table 3B shows the S&P vastly outperforms by up to 10 percent. However, in terms of VaR or ES, a secured put is the best strategy relative to DCA or the use of a protective put. Regarding risk-adjusted returns, the secured put strategy offers a higher Sharpe ratio outpaced only by the buy-and-hold strategy when 2.5-percent and 5-percent options are used. In terms of risk alone, the cash-secured put appears to be a valid alternative to more traditional strategies.
CONCLUSION AND IMPLICATIONS FOR INVESTORS
This paper examines the cash-secured put strategy and compares it with the traditional DCA and protective put strategies. Financial planners must present different options to risk-averse investors to convince them to enter the market. These investors are interested in obtaining the highest return possible but often are worried about the potential risks and prioritize risk over returns. The DCA strategy offers the advantage that the money is invested at different points, thus capturing periods of highs and lows in the market. The protective put strategy implies that investors purchase options to protect their positions. Instead of buying insurance (protective put), the cash-secured put strategy writes out-of-the-money put options. In this way, investors receive a discount of up to 10 percent to the current market price as examined in this paper, plus the option premium, a fact that can diminish the fear of entering the market at the wrong time.
This study employs data from 1990 to 2023 and finds that using 2.5-percent, 5-percent, or 10-percent out-of-the-money secured put options results in superior returns relative to DCA, protective puts, and the market itself if the puts are exercised within the year. Using the past thirty-three non-rolling independent annual returns also suggests this strategy can even outperform the market over time with the caveat that a new 100-percent cash position would have to be taken at the beginning of each year. Comparing non-overlapping returns, the S&P outperforms ten out of thirty-three years, but the secured put 2.5-percent, 5-percent, and 10-percent strategies outperform six out of thirty-three years each, meaning one form or another of a cash-secured put strategy outperformed in eighteen of the thirty-three years.
When the options are not exercised, the S&P outperforms all other strategies, which would be expected in a rising market. When the risk-adjusted returns are considered, the secured put strategy does best if the market declines and options are exercised or second when the options are not exercised (buy-and-hold strategy taking the first place). This outcome may be more important than the absolute returns from the risk-averse investors’ perspective. In effect, all these strategies attempt to balance the costs of loss aversion against the fear of missing out. This especially is true for the cash-secured put strategy if the written put option never ends up being exercised. None of these strategies is a magic bullet, and all have advantages and disadvantages. However, a cash-secured put strategy is a very attractive alternative to the more traditional DCA and the protective put strategy. This especially is true now with short-term interest rates exceeding 5 percent, mitigating the opportunity cost of the cash position.
William J. Trainor Jr., PhD, CFA®, is a professor of finance in the Department of Economics and Finance at East Tennessee State University. Anca Traian, PhD, is an assistant professor in the Department of Economics and Finance at East Tennessee State University. The authors report no conflicts of interest. The authors alone are responsible for the content and writing of the paper.
ENDNOTE
1. The Kolmogorov-Smirnova test for normality is best used with sample sizes larger than 50. This study had 389 observations. None of the test statistics exceeded 1.0 where 1.073 is the 20-percent level of significance, thus normality could not be rejected even at the 20-percent level. The one sample test used in this study was originally developed by A. Kolmogorov in 1933.
REFERENCES
Acerbi, C., and D. Tasche. 2002. On the Coherence of Expected Shortfall. Journal of Banking & Finance 26, no. 7 (July): 1,487–1,503.
Aggarwal, N., and M. Gupta. 2013. Portfolio Hedging Through Options: Covered Call Versus Protective Put. Journal of Management Research 13, no. 2: 118–126.
Bondarenko, O. 2014. Why Are Put Options So Expensive? Quarterly Journal of Finance 4, no. 3 (September): https://doi.org/10.1142/S2010139214500153.
Constantinides, G. 1979. A Note on the Suboptimality of Dollar-Cost Averaging as an Investment Policy. Journal of Financial and Quantitative Analysis 14, no. 2 (June): 443–450. https://doi.org/10.2307/2330513.
Csiszar, J. 2022. What Is a Bear Market vs. Bull Market? Nasdaq (June 14, 2022). https://www.nasdaq.com/articles/what-is-a-bear-marketvs.-bull-market.
Driessen, J., P. Maenhout, and G. Vilkov. 2009. The Price of Correlation Risk: Evidence from Equity Options. Journal of Finance 64, no. 3: 1,377–1,406.
Dubil, R. 2004. The Risk and Return of Investment Averaging: An Option-Theoretic Approach. Financial Services Review 13, no. 4: 267–283.
Foltice, B. 2022. Revisiting Covered Calls and Protective Puts: A Tale of Two Strategies. https://ssrn.com/abstract=3786342.
Israelov, R. 2019. Pathetic Protection: The Elusive Benefits of Protective Puts. Journal of Alternative Investments 21, no. 3 (winter): 6–33.
Israelsen, C. L. 1999. Lump Sums Take Their Lumps. Financial Planning (January): 51–60.
Jackwerth, J. 2000. Recovering Risk Aversion from Option Prices and Realized Returns. Review of Financial Studies 13, no. 2 (summer): 433–451.
Kahneman, D., and A. Tversky. 1979. Prospect Theory: An Analysis of Decision Making Under Risk. Econometrica 47, no. 2 (March): 263–292.
Knight, J., and L. Mandell. 1993. Nobody Gains from Dollar Cost Averaging Analytical, Numerical, and Empirical Results. Financial Services Review 2, no. 1: 51–61.
Kritzman, M., and D. Rich. 2002. The Mismeasurement of Risk. Financial Analysts Journal 58, no. 3: 91–100.
Leggio, K., and D. Lien. 2003. An Empirical Examination of the Effectiveness of Dollar-Cost Averaging using Downside Risk Performance Measures, Journal of Economics and Finance 27 (June): 211–223. DOI:10.1007/BF02827219.
Milevsky, M., and S. Posner. 2003. A Continuous-Time Reexamination of Dollar-Cost Averaging. International Journal of Theoretical and Applied Finance 6, no. 2: 173–194.
Rozeff, M. 1994. Lump-Sum Investing versus Dollar-Averaging. Journal of Portfolio Management 20, no. 2 (winter), 45–50.
Rubinstein, M. 1994. Implied Binomial Trees. Journal of Finance 49, no. 3 (July): 771–818.
Sortino, F. A., and L. N. Price. 1994. Performance Measurement in a Downside Risk Framework. Journal of Investing 3, no. 3 (fall): 59–54.
Trainor, W. 2005. Within-Horizon Exposure to Loss for Dollar Cost Averaging and Lump Sum Investing. Financial Services Review 14, no. 4 (winter): 319–330.
Ungar, J., and M. Moran. 2009. The Cash-Secured Put Write Strategy and Performance of Related Benchmark Indexes. Journal of Alternative Investments 11, no. 4 (spring): 43–56.
Williams, R. E., and P. W. Bacon. 2004. Lump Sum Beats Dollar-Cost Averaging. Journal of Financial Planning 17, no. 6 (June): 92–95.